Between the grand-kids’ equestrian competitions and soccer games, Sunday morning was the only time I could squeeze in a POTA/WWFF activation this week. Like most of my recent activations, it had to be early and short.
It had been a while since my last visit to Norristown Farm Park (US-4363, KFF-4363), so I headed over there. Before I headed out, I took a quick look at the band conditions. The A Index was around 6, the K Index was zero, and there was no geomagnetic activity. Now, I’m not an expert in this stuff, but that looked pretty good to me.

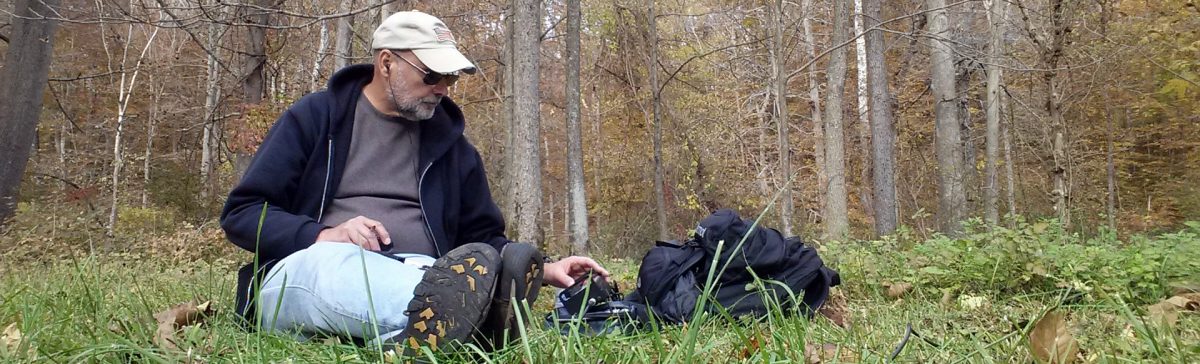
My original plan was to do this activation with some vintage QRP gear, but I wasn’t able to get all that together. Instead, I used my usual Penntek TR-35 (5 watts, CW), 12-foot whip, and my homebrew loading coil.

My band conditions app showed poor daytime conditions on 40M, but I found that wasn’t the case. Signals were strong and plentiful. My first 10 contacts only took 13 minutes to achieve. The 20M band was equally strong, so I spent some time there. Finally, I checked 17M, and picked up five more there.

In all, I had 32 contacts with two known park-to-park QSOs and one DX contact (F1BLL). Not too bad for an hour’s effort, I guess. Then it was time to head off to my grandson’s soccer game.
I have to remember to get that old gear together, so it’s ready to go for next time.
72, Craig WB3GCK

Craig, Solar conditions are always hard to read. Over time, I’ve found what I think is a better indicator than the ubiquitous chart you show … better than the A & K indices. Take a look at the “Global D-Layer Absorption” part of the Solar Ham site. Specifically the vertical scale (over on the right) showing dB absorption for the various frequencies. It seems to do a good job of showing when the D-layer isn’t so good at bouncing our signals. Some days those red lines are long, and results suck. Other days, when they’re short, I make a lot more QSOs.
Check it out at: https://solarham.com/globald.htm
72 N4REE Bob
LikeLike
Thanks, Bob. I’ll have to keep an eye on that. — Craig
LikeLike